Trading Journal vs Spreadsheet: Why Excel is Costing You Money in 2026
Why spreadsheet fatigue, missing context, and vanity metrics drain your edge—and how Pnlytic replaces manual Excel with imports, dashboards, and behavioral P&L in 2026.
- trading journal
- spreadsheet
- Excel
- trade analytics
- Pnlytic

Every trader knows the January ritual. You declare that this is the year you finally get disciplined. You open Excel or Google Sheets and build a masterpiece. You create columns for Entry, Exit, Risk-to-Reward, Setup, and Notes. You even color-code the cells so the green wins pop and the red losses sting just enough to teach you a lesson.
For the first two weeks, it works perfectly. Then comes a choppy, emotional Wednesday. You overtrade, break your rules, and take four unplanned scalps. When the closing bell rings, the last thing you want to do is open that pristine spreadsheet and manually type in your failures. You skip a day. Then two. By March, your spreadsheet is a digital graveyard of missing data and broken formulas.
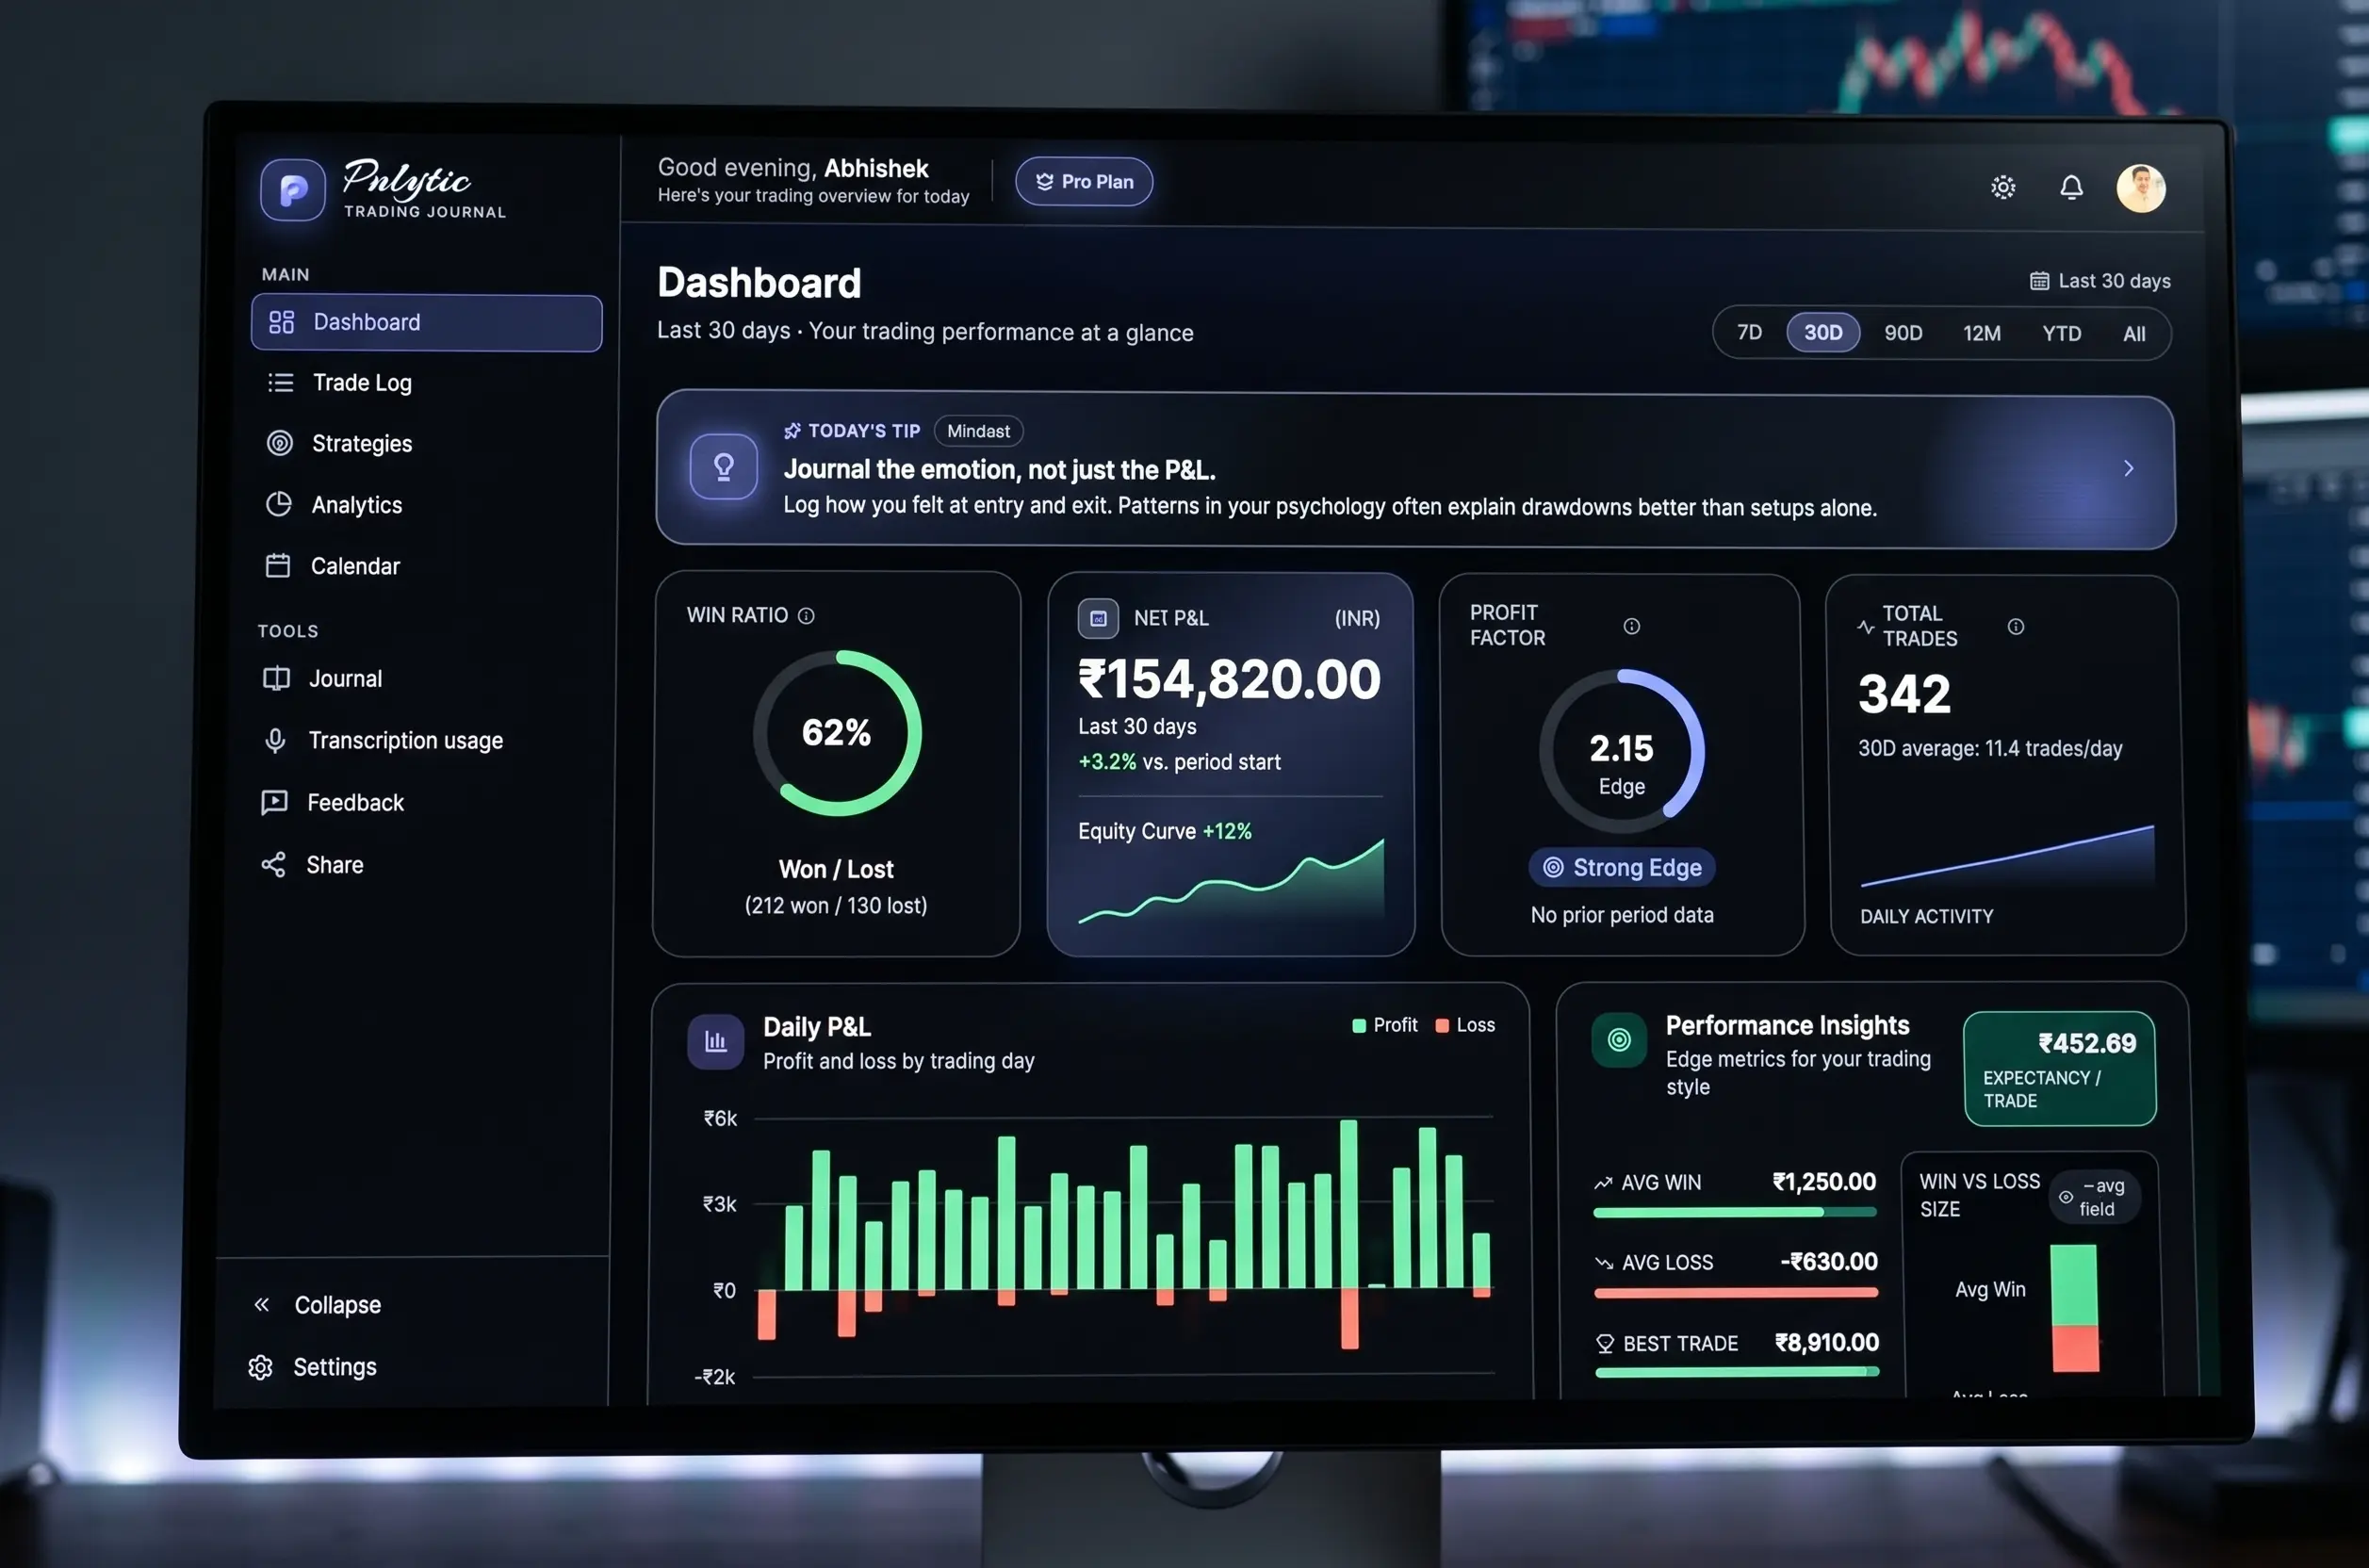
The debate between using a spreadsheet versus a dedicated trading journal is effectively over in 2026. While a spreadsheet is technically free, the hidden cost of friction, lost context, and missing analytics is slowly draining your edge.
Here is why relying on a spreadsheet is holding you back, and how modern journaling is changing the game.